


Research gives good look at our cosmic 'hood
 Print
Print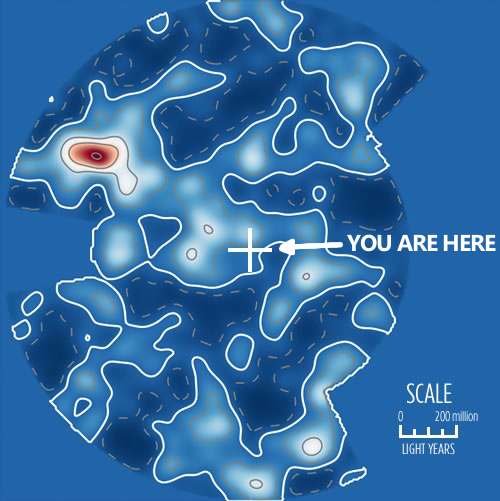 Astrophysicists have created a 3D map spanning nearly two billion light years, the most complete picture of our cosmic neighbourhood to date.
Researchers hope the spherical map of galaxy superclusters will lead to a greater understanding of how matter is distributed in the universe and provide key insights into dark matter, one of the greatest mysteries in physics.
“The galaxy distribution isn’t uniform and has no pattern,” says Professor Mike Hudson, from the University of Waterloo.
“It has peaks and valleys much like a mountain range. This is what we expect if the large-scale structure originates from quantum fluctuations in the early universe,” said Hudson, associate dean of science and computing.
The report on the massive mapping effort is accessible here.
Knowing the location and motion of matter in the universe will help astrophysicists predict the universe’s expansion and identify where and how much dark matter exists.
Scientists have observed that galaxies move differently because the universe's expansion is not even. These differences are called peculiar velocities.
Our own Milky Way galaxy and its neighbour Andromeda are moving with a speed of 2 million kilometres per hour, but previous models did not fully accounted for this observed motion.
Hudson and his team are interested in discovering what structures are responsible for the peculiar velocities. These deviations in the motion of galaxies are a valuable tool for determining the distribution of matter and dark matter on the largest scales.
Dark matter accounts for a large majority of the mass content in the universe. It is a hypothesized form of matter particle that does not reflect or emit light and as a result it can’t be seen or measured directly. The existence and properties of dark matter can only be inferred indirectly through its gravitational effects on visible matter and light.
“A better understanding of dark matter is central to understanding the formation of galaxies and the structures they live in, such as galaxy clusters, superclusters and voids,” said Hudson.
The next step will involve getting more detailed samples of peculiar velocities to enhance the map, in collaboration with researchers in Australia.
The video below shows the 3D map of the nearby Universe, taken in successive slices. The mapped volume is roughly circular, so the frames of the video are like slices of an orange taken vertically from the outer edge through to the opposite edge.
Regions with many galaxies are shown in white or red, whereas regions with fewer galaxies are dark blue.
The location of the Milky Way Galaxy is in centre of the middle frame, and appears briefly after the frame marked SGZ=0.